


Net Zero Indicators
While there may be a broad public understanding of what net zero greenhouse gas (GHG) emissions means, it can be hard to understand the progress we are making without relating them to every day actions.
The Carbon Neutral Plymouth report examined each sector and provided a series of net zero indicators which can be used to indicate our progress on greenhouse gas emissions reduction.
NET ZERO CLIMATE THEMES
Find out how we can cut our carbon emissions across the city by climate theme.

Travel

Buildings

Energy

Waste

Industry

F-Gases

Agriculture

Land Use
Travel Progress
There was a particularly sharp decline in greenhouse gases produced by the transport sector, 20% in fact, from 2019 to 2020, due to the Covid-19 pandemic travel restrictions.
Now we’re back to normal however, we’ve seen a bounce back. In 2022 we produced 343,131 tonnes of CO2e, up almost 50,000 tonnes since 2021.
Unfortunately, we’re still a long way off the path to net zero.
How will we measure our wider progress?
We can also measure our progress in other ways that show how we’re travelling around the city and tell us whether more of us are walking, cycling, using public transport and switching our vehicles to electric or using a car club.
Plymouth’s green house gas monitoring report includes some of these metrics and work is underway to establish other baseline metrics.
Metrics include:
Broadband Speeds
Proportion of City with access to min 25Mbps broadband speeds
Active Travel Journeys
Percentage of journeys through active travel
Buildings Progress
We emitted 258,372 tonnes of CO2e from our buildings in 2022, down by 21,670 in 2021. However, since 2008, we’ve made little progress. This means that every year from now on, we need to cut our carbon emissions even more drastically if we stand a chance of getting to net zero.
How Will We Measure Our Progress?
We can also measure our progress in other ways that show how well we’re doing at making our buildings more energy efficient and heating them from low carbon sources.
Improved EPC’s
Number of non-domestic buildings with Band D, E, F & G improved to Bands B & C
Cavity Wall Insulation
Number of homes with domestic cavity wall insulation installs
Solid Wall Insulation
Number of homes with domestic solid wall insulation installs
Loft Insulation
Number of homes with domestic loft insulation
Low Carbon Heating
Number of non-domestic buildings with low carbon heating
Heat Pumps
Number of buildings with domestic low carbon heat—heat pumps in homes
Energy Progress
We emitted 170,248 tonnes of CO2e from our power in 2022, down by 24,266 tonnes since 2021.
Since 2008, we’ve made good progress, but that’s largely because of the fuel mix of the national grid which supplies our electricity. The National Grid has been successful in shifting away from fossil-fuel based power stations to increased renewable energy.
In 2023/2024, renewables accounted for more than 55% of the UK’s total of electricity generated.
But we still depend on fossil fuels for almost half our electricity supply and our homes are almost all heated by gas. So we still need to do all we can to: increase our renewable energy capacity; reduce our energy consumption; and switch how we heat our homes to lower carbon options.
How Will We Measure Our Progress?
We can also measure our progress in other ways that show how well we’re doing at increasing renewable energy capacity and replacing fossil fuel energy supplies.
These metrics include:
Heat Pumps
Number of individual heat pumps
PV Installations
Number, capacity and generation of Solar Photovoltaics Panel (PV) installations
Low Carbon Heat Networks
Number and coverage of low carbon heat networks
What waste progress are we making?
We emitted 127,435 tonnes of CO2e from our waste in 2022, up by 150 the year before.
In 2022 and 2023, we increased our recycling rate to 36.7%, a big jump from 31.3% the year before, which means more materials that might have been sent to the energy from waste plant were recycled instead. We’re aiming to reach 65% recycling rate—if Wales can do it, so can Plymouth!
You’ll see from the graph that our emissions from waste went up in 2016 when the Devonport Energy from Waste plant started operating. This is a challenging situation. The waste hierarchy tells us that producing energy from our waste and using the heat to power local businesses is better for the environment than landfilling it. The best way to reduce our emissions definitively is to reduce our waste and recycle more.
N.B.
Plymouth’s waste emissions include all of the waste from our surrounding areas that is brought into the Plymouth.
How will we measure our progress?
We can also measure our progress in other ways that show how much waste we produce as well as what facilities there are to help us reduce our consumption.
Work is underway to establish baseline metrics. These metrics might include:
Waste Collected
Total household waste collected (incl per person)
Household Waste
Percentage of household waste that is sent for reuse, recycling or composting
Reuse Facilities
Number of reuse facilities
Commercial and Industrial Waste
Commercial and industrial waste; total arising, of which household-like waste and recycling rate.
Construction Waste
Construction, demolition and excavation waste; arising and recycling rate
Plymouth's Progress to Net Zero
This graph shows us the journey we are on to reach our goal of net zero.
The solid lines indicate our emissions data since 2008, while the dotted lines highlight the trajectory we need to align with to meet our goals.
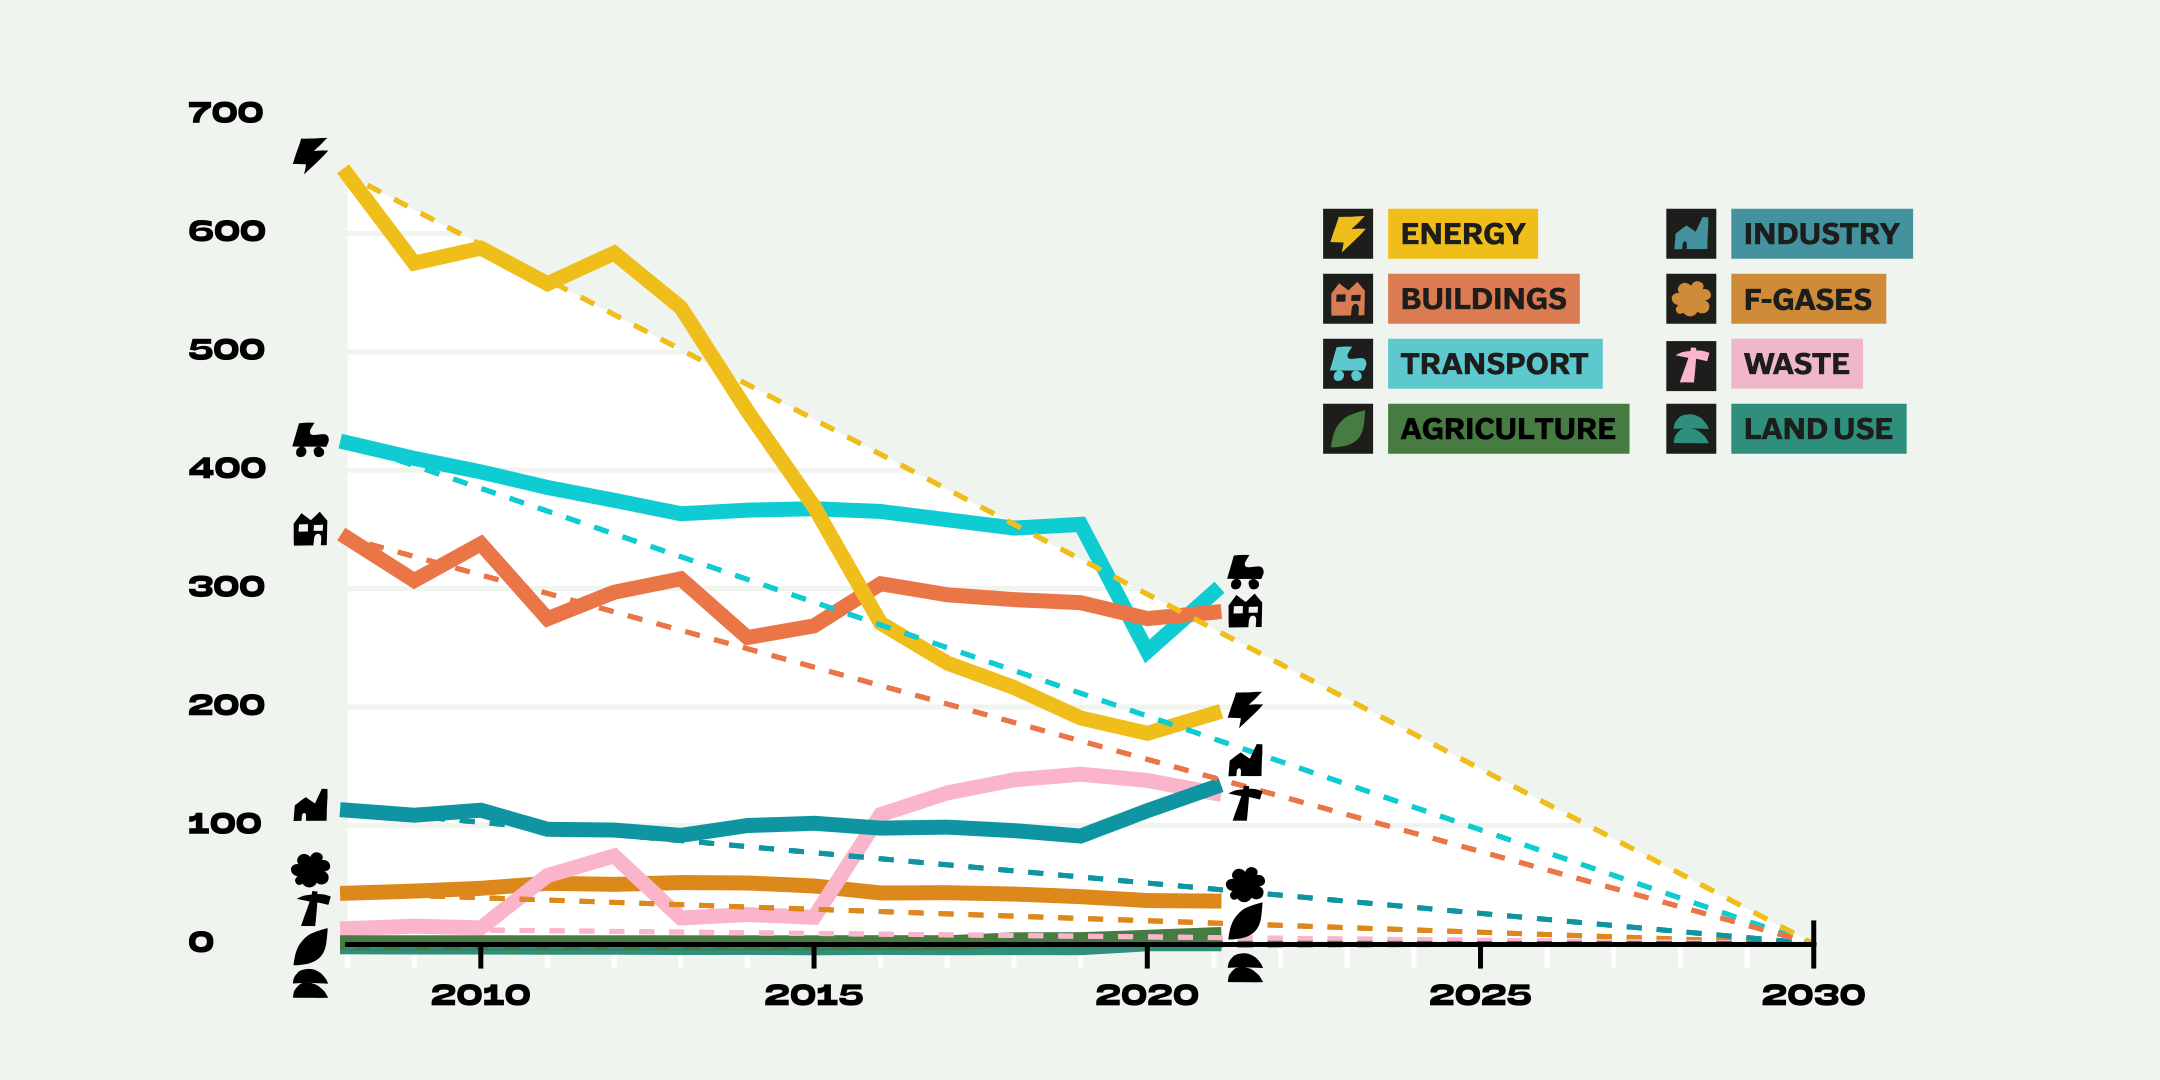
Emissions against a linear trajectory to net zero by 2030 (dotted), 2008 base, by sector.
We are making progress in some areas but we must do more to reach our goals. Find out how you can kick start your journey to net zero below.
| Sector | Metric | 2024 level | Net zero need | % trajectory achieved |
|---|---|---|---|---|
| Power & heat | PV capacity (MW) | N/A | 136.331667 | 25.92% |
| Domestic heat network connections | 2970.143548 | 7482.5568 | 39.69% | |
| Non-domestic heat network connections (% of floor area heated) | 0.021376198 | 0.22 | 9.72% | |
| Domestic buildings | Insulated pitched roofs | 32789.71737 | 92721.42488 | 35.36% |
| Insulated cavity walls | 50889.17031 | 61559.86865 | 82.67% | |
| Insulated solid walls | 18412.75352 | None (discontinued) | N/A | |
| Heat pumps installed | 385.1424321 | 97389.63208 | 0.40% | |
| Non-domestic buildings | Buildings with EPC rating A & B | 1071 | 5785 | 18.51% |
| Buildings with low carbon heating | 3444 | 5785 | 59.53% | |
| Industry | GHG emissions ktCO2e | N/A | N/A | N/A |
| Mobility | Miles per year (cars and taxis) | N/A | None (discontinued) | N/A |
| BEV cars registered in Plymouth | N/A | 117320 | 0.96% | |
| BEV LGVs registered in Plymouth | N/A | 15100 | 0.52% | |
| Zero emission HGVs buses and coaches registered in Plymouth | N/A | 1281 | 0.00% | |
| Public and workplace charging sockets | 306 | 2184.555547 | 14.01% | |
| Cycling activity (km cycled on major roads per year) | N/A | 49.3305582 | 5.46% | |
| Walking (total km walked per year) | Unknown | 139.4412643 | Unknown | |
| Waste | Waste arisings (tonnes) | 101655.4894 | 57181.67153 | 12.76% |
| Domestic recycling rate | 0.366363135 | 0.57 | 64.27% | |
| Non-domestic waste | Unknown | Unknown | Unknown | |
| Devonport EfW heat export GWh | Unknown | Increase | Unknown | |
| Devonport EfW CCS | Not installed | Install | Unknown | |
| F-gases | F-gases | Unknown | Unknown | Unknown |
Challenge
What do we need to do to get to net zero?
Getting to Net Zero boils down to one essential goal: reducing our carbon emissions to as close to zero as possible. That means thinking about how we live, travel, consume energy and more...
Find out